
| "The views expressed by others are not necessarily shared by me personally but all views and perspectives are respected" |
A lot has taken place regarding the national weather radar and weather strangeness appearing
over the continent of Australia since I decided to end my month long research project into these
odd radar shapes. My project began on January 15th 2010 following an e-mail from a friend
about a white ring seen over the south west of the country. He had a hunch something was out
of place.
My decision to end the project on February 13th came when I felt that enough data had been
gathered and presented to lay a sound foundation for further research by others. I have a
limited amount of expertise as an amateur meteorologist which allowed me to see that this was
an unprecedented situation. Each pattern WAS centered over a radar station and therefor was
a result of information, or interrupted information, from the station. The government Bureau of
Meterologu\y (BOM), told me that they thought the corrupt information was the result of
unknown interference. The question then becomes whose interference, and how have so
many stations across the country become involved? To the time of this writing, BOM are still
trying to resolve these questions.
There are, though, even more important questions beyond that. Why, on two occasions over
Melbourne, did new weather systems spin out from under the dramatic mysterious interference
patterns? Why do ominous black clouds, also associated with the radar interference patterns,
remain over the vicinity for hours without the anticipated precipitation? Why have these
dramatic patterns only been seen continuously since January 15th, and not before?
So one can see that although my project ended on February 13th, the high strangeness did
not, and many people around the world continue to be intrigued just as many professional
meteorologists continue to be baffled. Originally stating that these symbols were stray
artifacts, like thousands of others meteorologists were seeing on their televisions and
computer screens more symbols that seem to support something beyond a few stray signals or
adjustment problems on radar sets.
What took place today (Feb. 19th) made me decide I should post this update.
For those who want to start at the beginning of this project look HERE. To see what has taken
place since the end of the project, read now what I posted today on my blog - copied here for
your convenience:
Friday, February 19, 2010
EXPLOSIVE ENERGY LEVELS CAUSE AUSTRALIAN RADAR
INTERFERENCE AND ANOTHER NEW WEATHER SYSTEM FORMS.
OK- it’s time for serious answers from the authorities as the Australian government Bureau of
Meteorology (BOM) have themselves been propelled into posting a notice that they are
“endeavoring to find the source of interferences" into, not just one radar station the last four
weeks, but many. Late last night (Feb 18th here in USA - Feb 19th in Australia), the most
bizarre symbol yet appeared on the national radar emanating from the Melbourne facility. On
the radar screen, a black and red-laced, counter-clockwise spiral appeared with a separate red-
flared spiral overlay in its center. The last time we observed something similar to this, the first
time it had ever been seen, I noticed that the lower levels of the atmosphere began to rotate in
the same counter-clockwise direction. As I watched, a new pressure system formed under the
radar symbol - unprecedented physical reflection of the radar image. This was either an
extreme coincidence, where a frequency interference and technical artifact took place at the
same time that nature also happened to create a new pressure system, or this was a designed
effect.
Last night for a second time, just as on the last occasion, a high pressure formed under the
amazing radar image which seems to be reflective of a burst of energy. An energy which I think
it’s reasonable to speculate, may have created both the frequency interference on the BOM
radar system, and the developing weather system. I can believe that the first was possibly
coincidental, a second time over the same city and I need an explanation. Sorry, but I don’t buy
this is anything straight forward, like a local station causing interference where it had not been
before, and on such a large scale with apparent physical effects on weather. This is real, large
scale, and seems to be affecting the earth’s atmosphere. It must be addressed.
Time loops are being put together, as I speak, for our own records. Data of what has happened
exists in the BOM records and should be used to answer these serious questions. This month
has shown extreme circumstances and few answers, on a continent that has been significantly
altered by weather conditions during that same period. The findings of this project must be
given official attention and made public. I urge those who have been kind enough to help me
keep close observations on this situation, as well as the general public, to send the links on my
website regarding this subject to your representatives. Also send them to BOM asking for a
station-by-station, event-by-event explanation. The latest event over Melbourne last night and
into today, requires a full technical detailed explanation.
“Melbourne at the center of something strange from above or below:
HAARP?”
It all started here, but since then, there have been many strange symbols,
tropical storm Olga, and two human made weather systems, this is the map.
Now is someone going to explain what is going on over Australia?
Colin Andrews - February 19, 2010.
tropical storm Olga, and two human made weather systems, this is the map.
Now is someone going to explain what is going on over Australia?
Colin Andrews - February 19, 2010.


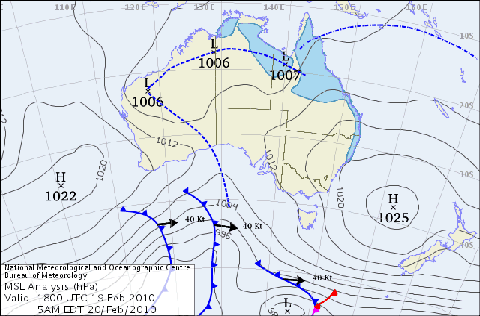

The intense High Pressure system buckled on its 1020 Mb contour when
the radar spiral appeared over Melbourne- both the radar spiral and a
brief high pressure spiral shared the same center - is that coincidence?.
Copyright Australian Bureau of Meteorology
the radar spiral appeared over Melbourne- both the radar spiral and a
brief high pressure spiral shared the same center - is that coincidence?.
Copyright Australian Bureau of Meteorology
Wind direction data from BOM
Note: I have inserted orange arrows for
clarity. Copyright Australian Bureau of Meteorology
Note: I have inserted orange arrows for
clarity. Copyright Australian Bureau of Meteorology
Following the radar spiral, the extensive High Pressure system is nudged
away. Copyright Australian Bureau of Meteorology
away. Copyright Australian Bureau of Meteorology
The much improved water situation across much of Australia has taken place since the
events that have unfolded this last month but as can be seen from the chart above the south
and south west are still lacking rainfall. If I was a speculator and based upon what we have
seen since mid January, I would say the efforts to move the High Pressure system from the
south east of the country was a man made effort to bring rains to those parts. We will see.

The satellite showing a strong west to east flow and the first significant band of cloud with the
complex series of lows stretching from Melbourne to the south east to Perth in the west. The
regular frontal banding stretching on this latitude is spread out around the planet and is very
impressive. We are not looking at some small toy here. Image Copyright BBC.
complex series of lows stretching from Melbourne to the south east to Perth in the west. The
regular frontal banding stretching on this latitude is spread out around the planet and is very
impressive. We are not looking at some small toy here. Image Copyright BBC.
Rainfall Chart from 1-19 February 2010 shows most of the country have gotten some rain.
Copyright Australian Bureau of Meteorology
Copyright Australian Bureau of Meteorology
February 19, 2010. Copyright Australian Bureau of Meteorology
Please consider making a small donation to allow this work to continue
| 165 |
To read from the beginning of this Article

The radar patterns and locations across Australia between January 15 - February 19, 2010.
Copyright: Colin Andrews 2010
Copyright: Colin Andrews 2010
| The 1020mb isobar buckled toward the high which changes the pressure gradient force to make a trough. The counterclockwise rotation is associated with the high. We must remember the coriolis force is negative in the Southern Hemisphere so cyclonic vorticity is associated with good weather. In the wind direction chart we can see the anticyclonic vorticity associated with the trough with two wind vectors being 180 degrees different west of the radar site near the trough line. The important question here is: Does it cause weather (vertical motion)?? Well take a look at the time loop we have constructed of what the satellite was seeing during and after the radar 'flash'. The cloud cover (believed low level) began rotating in a near perfectly defined circle, most noticeable on the southern radius. This circle cut into the atmosphere appears to elongate as it moves east with the receding high. Is this proof of a vertical component? Any more ideas and comments from meteorologists who have been good enough to send professional information and ideas would be appreciated. CONTACT ME HERE. Incidentally, the time loop was re-constructed by Jack Verbeek because the Bureau have removed the ability to save these loops since this project began. I want to reiterate that my feeling is that the Bureau employees are good guys and doing a good job. They have one of the most informative sites anywhere, perhaps they regret that at this moment but the fact they don't know what is going on is probably not of there making. |
| IMPORTANT CORRECTION. ONE WHICH STRENGTHENS THE CASE THAT SOMETHING DELIBERATE IS TAKING PLACE. Colin Andrews Feb 20, 2010 |
| Check my Weather Observatory HERE Australia Weather - thanks to Australia Bureau of Meteorology Radar Viewer National Satellite and Radar Loop Weather Maps Sea Level Pressure Chart Rainfall Global - NASA Real Time Global Weather - NASA |
February 19, 2010
Melbourne.
Shortly after this radar interference appeared on the Melbourne station, a large High
Pressure system centered just off the coast buckled temporarily on the north west side of its
central pressure center of 1026 mbs. By this I mean to say the 1020mb isobar buckled
toward the high which changed the pressure gradient force to make a trough.
The counterclockwise rotation is associated with the high. We must remember the coriolis
force is negative in the Southern Hemisphere so cyclonic vorticity is associated with good
weather.
In the wind direction chart below we can see the anticyclonic vorticity associated with the
trough with two wind vectors being 180 degrees different west of the radar site near the
trough line.
The question here is does it cause weather (vertical motion)??
Well take a look at the time loop we have re-constructed from the satellite data from two
hours before the image to nine hours after.
You can see the cloud cover (believed low level) begin to rota in a near perfectly defined
circle. This circle is an area devoid of cloud cover and its appearance in the atmosphere
shows its proximity to the radar circle as it moves east it becomes elongated and looses
form. Is this proof of a vertical component?
The barometric pressure graph below covers the period February 19th at 12.0 AM to the
20th at 11.31 AM. The chart shows that the pressure rose to a peak just before the event
which is shown by an arrow and dropped quickly after it. We have a lot of data surrounding
this particular event, what does it mean?
Also don't let us forget that the Australian government passed legislation permitting weather
modification experiments. The document seen HERE was placed before the members and
failed to pass because An act before congress for weather modification. This bill never got
passed, because a larger more encompassing global one did.
Any more ideas and comments from meteorologists who have been good enough to send
advice and their ideas would be helpful: Contact
Incidentally, the time loop was re-constructed by Jack Verbeek because the Bureau have
removed the ability to save these loops since this project began. I want to reiterate that my
feeling is that the Bureau employees are good guys and doing a good job. They have one
of the most informative sites anywhere, perhaps they regret that at this moment but the fact
they don't know what is going on is probably not of their making.
The barometric pressure graph from February 19th at 12.0 AM - February 20th at 11.31 AM. Observe the
pulse of high pressure before the event and sudden reduction following it as the high moved away.
Copyright: Jack Verbeek.
pulse of high pressure before the event and sudden reduction following it as the high moved away.
Copyright: Jack Verbeek.

Reconstruction from original frames by Jack Verbeek

Clouds over Cape York, Australia 2009.

| The clouds as seen from the streets of Melbourne two days later, February 21, 2010. Courtesy tj. |
| "Also don't let us forget that the Australian government passed legislation permitting weather modification experiments. A similar one to that placed before the United States Congress seen HERE was placed before the members and failed to pass because a larger more encompassing global one did". |

=============================================================
A report of happenings today
February 23, 2010.
Colin Andrews
A site somewhat short of the dramatic radar symbols but equally as baffling, more so is Port
Hedland on the north west coast. Pretty much continuously the local and national radar shows a
ringed area of cloud, this cloud frequently shown as clouds which reach high up into the
atmosphere and producing heavy precipitation while the satellite shows no or little cloud at all.
Today (February 23, 2010) is no exception but notice that the visible satellite shows a quadrant
of a ring of missing cloud cut like a cookie cutter out of the surrounding cloud cover. From the
photographs below and taken off of the Bureau's site, one can see clearly the difference
between what the local radar says is there and what the visible satellite is seeing are two
different things. Why when there is no cloud is radar seeing large deep clusters of likely
cumulonimbus clouds?
Today again Ive received E-mails from across Australia of people telling me that they have large
black clouds over them and no rain and others that there is heavy rain falling out of almost
empty skies. Others speak of no rain but violent lightning like nothing they have seen before.
Apart from the on going anomalies around Port Hedland, today again saw a star burst pattern
over Broome and another broken white ring from Geraldton on the west coast.
Posted February 23, 2010.
Colin Andrews


February 23rd - Port Hedland with radar
February 23rd - Port Hedland Satellite without
radar and note cookie cutter ring quardrant.
radar and note cookie cutter ring quardrant.


| February 20, 2010 - Satellite only |
February 20, 2010 - Radar showing clouds and
precipitation that the satellite (left) does not show.
precipitation that the satellite (left) does not show.
| February 23, 2010 - Geraldton |
February 23, 2010 - Yet another star
burst on Broome radar.
burst on Broome radar.
| Update: February 23, 2010. |

NASA Taken Back by Surprise Ripples in the Clouds during the
latest launch from Cape Canaveral - HERE
latest launch from Cape Canaveral - HERE

| BUREAU RESPOND TO MY LATEST E-MAIL FOR EXPLANATIONS: HERE |
| The hundred year drought is over and the dams are full or filling: HERE |
| UFO and new pattern appear over Sydney HERE |
I asked Tom Bearden what he thought about the strange patterns that
appeared on the Australia Bureau of Meteorology radar system during the
exact same period the weather dramatically shifted gears over the continent ?
Colin Andrews. Posted March 4, 2010
HERE
appeared on the Australia Bureau of Meteorology radar system during the
exact same period the weather dramatically shifted gears over the continent ?
Colin Andrews. Posted March 4, 2010
HERE
On March 6th, the 1000 year super drought suddenly
turned into the 100 year super storm over the south
east HERE.
turned into the 100 year super storm over the south
east HERE.
| Easy access to whole project. SELECT |
| Australia starts 2012 with more mysterious radar interference patterns and rapidly changing weather. From severe lightning storms to cyclones, seemingly out of thin air. By Colin Andrews Posted January 13th, 2012 My thanks to the most proactive visitors to this site:James Dumar (Australia), Dean Muir (Aust), Anna (Aust), Bev (Aust) Solveig (Aust) and Roger Thornewell (Aust) HERE |